
Europe’s Natural Gas Outlook for the Upcoming Winter 2026/2027
Europe is entering the 2026–27 winter with unusually low natural gas inventories. At the end of September 2026, gas storage in the EU was about 72 percent full, the lowest fill rate for that month since EU-wide data are available (from 2011) and about 11 percentage points below last September. Germany's inventories were especially low, at 58 percent full (Figure 1).2 The low inventories coincide with a tighter global market for liquefied natural gas (LNG) as the ongoing conflict in the Middle East has disrupted LNG shipments from Qatar through the Strait of Hormuz (IEA, 2026b); European wholesale gas prices have more than doubled since February.3 These developments have raised concerns about whether Europe's gas supply will last through the upcoming winter.
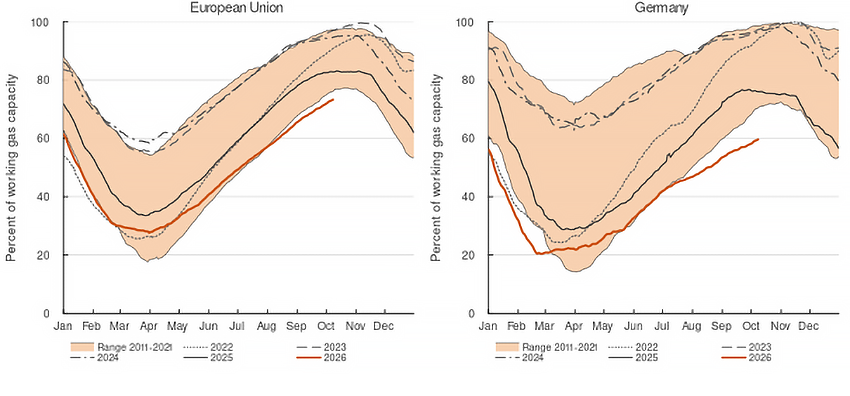
Note: Natural gas in storage as a percent of working gas capacity, for the EU (left) and Germany (right). The shaded band shows the range of the years 2011 to 2021, the gray lines, from light dotted to dark solid, the years 2022 to 2025 and the red line 2026, through October 8.
Source: Gas Infrastructure Europe, AGSI+, via Haver Analytics.
Against this backdrop, this note considers under what conditions Europe could face gas shortages during the 2026–27 winter. Following the analysis in Rua (2023) of Europe's energy position ahead of the 2023–24 winter, this note projects EU gas inventories through June 2027, under a Baseline and two adverse scenarios. The projections suggest that Europe can get through an average winter without running out of gas, and through a harsh winter too, albeit with stocks lower than it has tolerated in the past. However, a notable decline in LNG imports would leave storage nearly empty by the spring.
Projecting inventories requires assumptions about inflows from abroad, domestic production, and consumption, and all three now look very different from before Russia's invasion of Ukraine. The note therefore first documents how these flows have changed since 2021, using monthly data on the EU's imports by country of origin and on gas consumption, and drawing on companion work on the structural decline in gas demand.4
Inflows: Norway and LNG have replaced Russian pipeline gas
Russian gas has largely disappeared from Europe's supply. Imports from Russia fell from about 158 billion cubic meters (bcm) in 2021 to 40 bcm in 2025, or from 44 percent to 13 percent of the EU's imports from outside the EU (Figure 2).5 Since the transit contract through Ukraine expired at the end of 2024, Russian pipeline gas has reached the EU only through TurkStream (Sharples, 2025), and more than half of the remaining Russian gas arrives as LNG, which the EU has banned under short-term contracts since April 2026 and will ban under the remaining long-term contracts from January 2027.6 Norway has replaced Russia as the largest supplier of natural gas to the EU while production within the EU has fallen by 13 bcm between 2021 and 2025, mainly because the Netherlands wound down and closed the Groningen field.
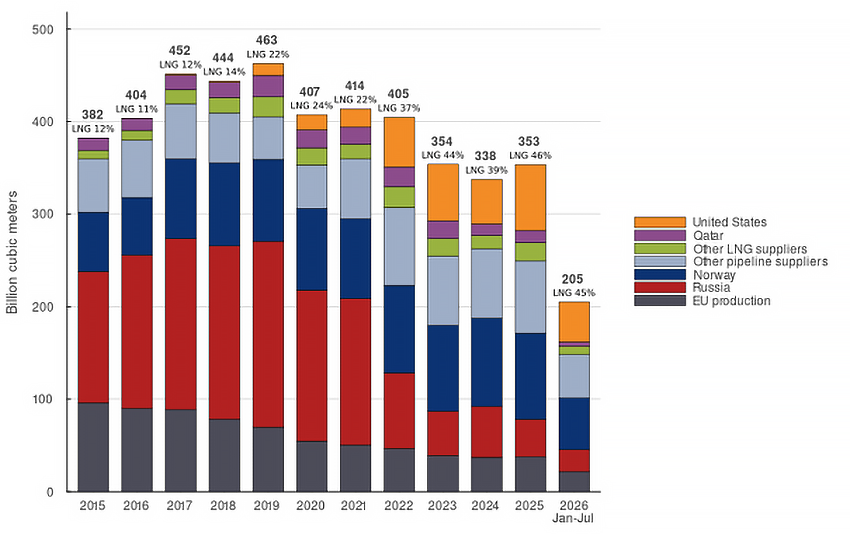
Note: Imports of the 27 EU member states from outside the EU, estimated from the monthly imports that member states report, plus EU production; the United Kingdom is treated as a non-EU country in all years. Transit countries are reassigned to the country of origin. Percentages above the bars give LNG's share of imports. Other pipeline suppliers are Algeria, Azerbaijan, Libya, the United Kingdom and unreported origins; other LNG suppliers are Nigeria and smaller sources. Poland's production, confidential since October 2023, is estimated from its annual figures. The last bar covers January to July 2026. Key identifies in order from top to bottom.
Source: Eurostat (nrg_ti_gasm, nrg_ti_gas, nrg_cb_gasm, nrg_bal_c); author's calculations.
LNG has filled about half of the gap left by Russian gas. LNG imports nearly doubled, from 80 bcm in 2021 to 146 bcm in 2025, when they accounted for 46 percent of imports. About three quarters of that additional LNG came from the United States. Perhaps surprisingly, despite the disruptions to global energy markets that began in February 2026, imports from outside the EU were only 1 percent lower than a year earlier during the first seven months of 2026, and LNG accounted for 45 percent of the EU's total gas imports, similar to its share for all of last year.
The reason for this resilience is that, while about one-fifth of the world's LNG passes through the Strait of Hormuz, most of it is bound for Asia and Qatar supplied only about 9 percent of the EU's LNG in 2025 and about 6 percent in the first seven months of 2026. In comparison, the United States supplied about 50 percent in 2025 and in the first seven months of 2026.7
Its new reliance on LNG makes Europe's gas supply more exposed to global market conditions. For example, as Asian buyers lose Qatari supply, they compete with Europe for cargoes from the Atlantic basin. To explore the consequences of Europe's increased exposure to the global LNG market, the Import Scarcity scenario in the analysis below focuses on the risk to the European gas supply due to LNG import reductions.
Consumption: lower, especially in winter
On the demand side, EU gas consumption fell from 413 bcm in 2021 to 332 bcm in 2024, a decline of about 20 percent (Figure 3). All end users cut back: households, industry, power plants and services. Consumption edged up slightly in 2025, mainly because power plants burned more gas. In the first seven months of 2026, Europe consumed about 1 percent more than a year earlier but still 19 percent less than during the same months of 2021.
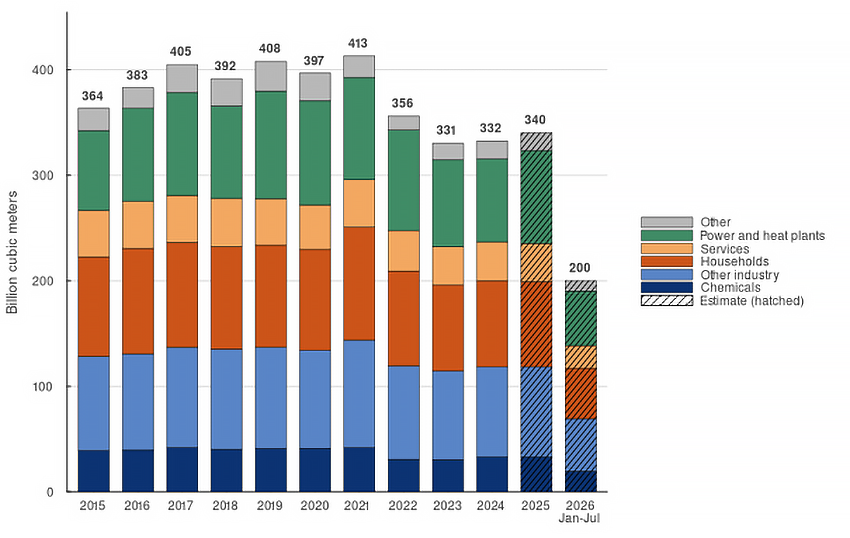
Note: Inland consumption (Eurostat's measure of all natural gas used within a country, including in power plants and as feedstock) of the 27 EU member states. For 2015 to 2024, annual consumption is split by end user with the shares in the annual energy balances. Chemicals includes non-energy use (feedstock); other industry includes firms that generate their own electricity and heat; power and heat plants are main-activity producers; other comprises the energy sector's own use, distribution losses, transport and agriculture. 2025 and January to July 2026 (hatched) are estimates from monthly data. Key identifies in order from top to bottom.
Source: Eurostat (nrg_cb_gasm, nrg_bal_c); author's calculations.
Part of this decline reflects mild weather as heating degree days in the four winters since Russia's invasion of Ukraine were notably below normal. To isolate the decline not due to warmer winters, country-level models of monthly consumption with month effects, heating and cooling degree days and the pre-crisis level of consumption are estimated on data from January 2015 to August 2021.8 The resulting parameter estimates are used to project consumption using observed heating and cooling degree days from September 2021 onward under the relationship between heating degree days and gas consumption which existed before 2022. Thus, the gap between this weather-adjusted counterfactual and actual consumption measures the decline that is not explained by weather (Figure 4).
When accounting for weather effects in this manner, EU consumption remained about 15 percent below its pre-crisis level in 2023 to 2025. In the first seven months of 2026, the decline was about 13 percent. While the decline has narrowed somewhat in the heating season (to about 11 percent in the past two winters, from 15 percent in the two before), it has held up outside the heating season. For example, in June and July 2026, when an unusually hot summer would have raised gas use in power plants before the crisis, consumption was about a quarter below the pre-invasion counterfactual.
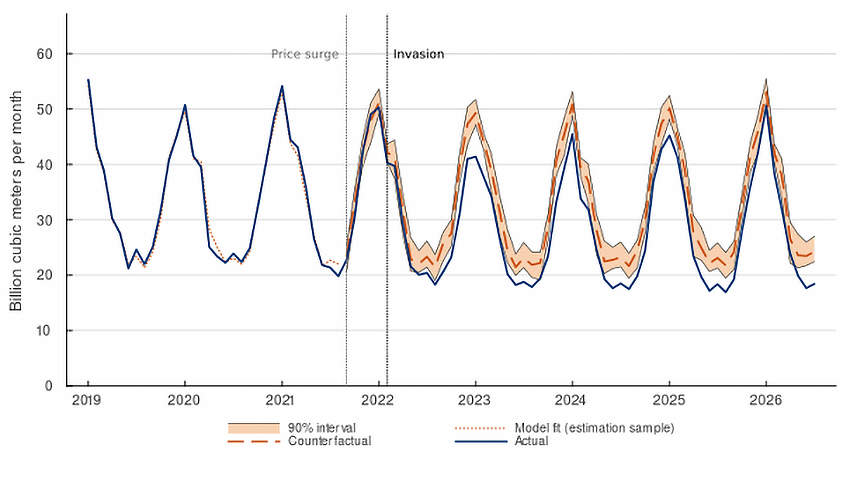
Note: Monthly inland consumption (as in Figure 3) of the 25 EU member states with a gas market (all except Cyprus and Malta). The counterfactual sums country models estimated on January 2015 to August 2021 data and projected with actual weather; the shaded area is the 90 percent bootstrap interval. Degree days for 2026 are computed from city temperatures calibrated to Eurostat's series for the euro-area countries and estimated from neighboring countries for Czechia, Denmark, Hungary, Poland, Romania and Sweden. The vertical lines mark September 2021, when prices first surged, and February 2022, when Russia invaded Ukraine.
Source: Eurostat; Open-Meteo (ERA5); author's calculations.
Inventories this winter: a baseline and two scenarios
These insights shape the projections of EU gas inventories from October 2026 through June 2027 (Figure 5), as they require basing expected consumption on the winters since the invasion. Stocks are rolled forward month by month, accounting for domestic production, net imports and consumption, starting from a stock of about 80 bcm at the end of September 2026. The first scenario ("Baseline") assumes that domestic production, imports from Russia and net imports from all other countries in each month equal their level in the same month a year earlier, and that consumption equals its average for that month over the four winters since the invasion (2022–23 to 2025–26). The second scenario ("Harsh Winter") keeps the Baseline's supply assumptions but sets consumption in each month to its maximum over those winters. Thus, even though the past four winters were relatively mild in historical comparison, this scenario still provides a meaningful representation of gas consumption under extreme weather conditions, such as the exceptionally cold winter of 2012–13, which had 14 percent more heating degree days than normal.
The third scenario ("Import Scarcity") assumes that Europe can only secure smaller LNG supplies from the global market: pipeline imports, exports and consumption are as in the Baseline, but LNG imports in each month are reduced by one-third from their level a year earlier. This is a pessimistic scenario as it assumes that Europe would have to proportionately share the decline in LNG supply due to a complete closure of the Strait of Hormuz (one-fifth of global LNG supply) and would also receive fewer deliveries from its established LNG providers, such as the United States and Algeria.9
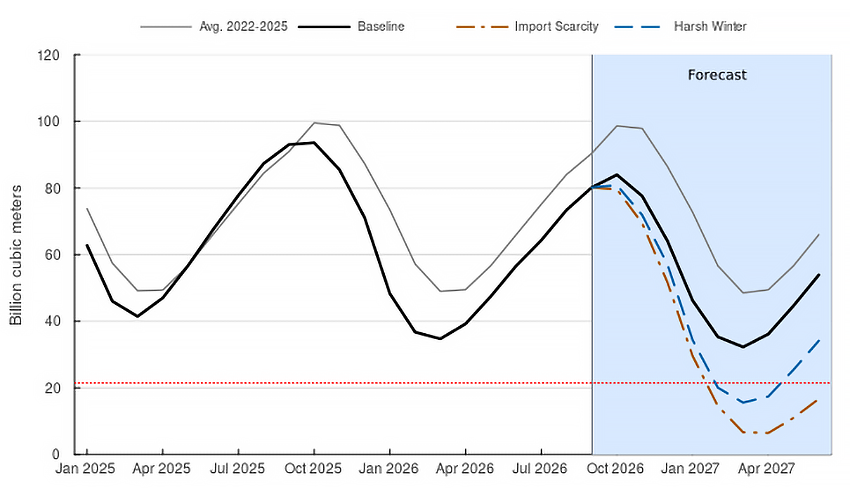
Note: Stocks are end-of-month natural gas in storage in the 27 EU member states (national territory and abroad, Eurostat definition); August and September 2026 are estimated from GIE AGSI+ daily data. Baseline: domestic production, imports from Russia and net imports from other countries in each month equal the same month a year earlier; consumption equals its average for that month over the winters 2022–23 to 2025–26. Harsh Winter: as the Baseline, but consumption at its maximum for that month over those winters. Import Scarcity: pipeline imports, exports and consumption as in the Baseline, LNG imports at two-thirds of the same month a year earlier. Avg. 2022–2025: the average storage fill rate for each month over the winters 2022–23 to 2025–26 applied to current storage capacity. The red dotted line marks 20 percent of storage capacity.
Source: Eurostat (nrg_cb_gasm, nrg_ti_gasm) and GIE AGSI+, both via Haver Analytics; author's calculations. Eurostat data through July 2026; GIE data through September 30, 2026.
In the Baseline scenario, inventories enter the winter well below their recent average. Storage peaks at about 84 bcm in October 2026, compared with about 99 bcm on the path implied by the 2022–25 average fill rates. Inventories fall to about 32 bcm at the end of March 2027, or 30 percent of storage capacity, before refilling begins. That is below the troughs of the past two winters but above the 20 percent of capacity to which EU countries have historically allowed stocks to fall (Rua, 2023).10
In the Harsh Winter scenario, stocks fall to about 16 bcm at the end of March 2027, or 15 percent of capacity, and stay below the 20 percent mark from February to April. In the Import Scarcity scenario, stocks fall to about 6 percent of capacity in April 2027, far below any level seen since 2011, and they remain below the 20 percent mark through June, so that refilling would start from almost zero. In all three scenarios, refilling for the 2027–28 winter would start from a lower level than this year, requiring stronger inflows than in previous years.
How much LNG could Europe lose and still get through the winter? Variants of the Import Scarcity scenario cut LNG imports to other shares of last year's level, which was about 77 bcm over October to March. With LNG at 80 percent of that level, stocks bottom out close to the Harsh Winter path. At 70 percent, they fall to about 9 bcm. At 60 percent, storage is all but empty in April 2027. In other words, a loss of about one-fifth of last year's LNG imports leaves filling levels close to the Harsh Winter path and near the critical 20 percent filling mark; beyond that, each further tenth of lost LNG imports takes roughly another 8 bcm off the trough, so that at a one-third loss storage is nearly empty and at 40 percent it is all but exhausted.
Will El Niño help?
A very strong El Niño is under way. The Oceanic Niño Index of the National Oceanic and Atmospheric Administration (NOAA) reached +2.16 for July to September 2026, the highest value for that season since records began in 1950 on the traditional index, and NOAA puts the chance that the event becomes the strongest since 1950 at 83 percent for October to December.11 El Niño affects European winters mainly through the North Atlantic. According to the literature, moderate El Niño events tend to bring cold late-winter weather to northern Europe, partly because El Niño makes sudden warmings of the stratosphere, which weaken the polar vortex, more likely (Ineson and Scaife, 2009). The response reverses as events become stronger, with high pressure over the eastern Atlantic and western Europe (Toniazzo and Scaife, 2006; Ineson and others, 2026). In the five strong El Niño winters since 1980, heating degree days in the EU, weighted by gas use, were on average about 6 percent below their trend, and all five had fewer heating degree days than trend (though 1991–92 only barely).12
A winter about 6 percent milder than trend would lower non-power gas consumption by about 4 bcm in the EU. The Baseline already builds in four mild winters, however, and measured against their weather the saving shrinks to only about 2½ bcm. That cushion is also uncertain because the evidence rests on only five winters, the event expected this year would be stronger than any of them, and the stratospheric channel that brings late-winter cold spells cannot be ruled out: no sudden stratospheric warming occurred in the strong El Niño winters of 1982–83, 1997–98 and 2015–16, but one did in 1972–73 and another in January 2024, with little effect on the surface (Ineson and others, 2026). Thus, a very strong El Niño improves the odds for Europe's gas balances to last through the upcoming winter, but it does not rule out the cold snaps that matter most when storage is low.
References
European Union (2026). Regulation (EU) 2026/261 of the European Parliament and of the Council of 26 January 2026 on Phasing Out Russian Natural Gas Imports. Official Journal of the European Union, L, February 2, 2026.
Fleck, Johannes (2026a). "How Much Has Europe's Gas Demand Fallen since 2022?," Working Paper.
Fleck, Johannes (2026b). "The Effect of Warmer Summers and Winters on Europe's Post-2022 Gas Demand," Working Paper.
IEA (2026a). Strait of Hormuz Factsheet. Paris: International Energy Agency, February.
IEA (2026b). Gas Market Report, Q3-2026. Paris: International Energy Agency, July.
Ineson, Sarah, and Adam A. Scaife (2009). "The Role of the Stratosphere in the European Climate Response to El Niño," Nature Geoscience, vol. 2, pp. 32–36.
Ineson, Sarah, and others (2026). "Prediction of European Winter 2023/24: Influence of a Strong El Niño," Atmospheric Science Letters, vol. 27, no. 2, e70006.
Keliauskaitė, Ugnė, Ben McWilliams, Giovanni Sgaravatti, and Georg Zachmann (2022). "European Natural Gas Imports," Bruegel Datasets, version of September 10, 2026 (legacy dataset, data through July 2, 2026).
NOAA Climate Prediction Center (2026a). "El Niño/Southern Oscillation (ENSO) Diagnostic Discussion," September 10.
NOAA Climate Prediction Center (2026b). "El Niño/Southern Oscillation (ENSO) Diagnostic Discussion," October 8.
Rua, Gisela (2023). "Europe: Well-Positioned to Get through Next Winter without Major Gas Shortages," FEDS Notes. Washington: Board of Governors of the Federal Reserve System, August 7, 2023.
Sharples, Jack (2025). "The End of Russian Gas Transit via Ukraine: Immediate Impact and Implications for the European Gas Market in 2025," Energy Insight 162, Oxford Institute for Energy Studies, January.
Toniazzo, Thomas, and Adam A. Scaife (2006). "The Influence of ENSO on Winter North Atlantic Climate," Geophysical Research Letters, vol. 33, L24704.
1. Board of Governors of the Federal Reserve System. I thank Deepa Datta and Shaghil Ahmed for helpful comments and suggestions. The views expressed in this note are those of the author and do not necessarily reflect the views of the Board of Governors of the Federal Reserve System. Return to text
2. Storage data are from Gas Infrastructure Europe's AGSI+ platform, via Haver Analytics. EU storage was 71.6 percent full on September 30, 2026, 10.9 percentage points less than a year earlier; German storage was 58.0 percent full. The daily EU-wide data begin in January 2011. Return to text
3. ICE TTF front-month futures, settlement prices, via Haver Analytics: the September 2026 average was €76 per megawatt hour, against €32 a year earlier, with a high of €84 on September 14. Return to text
4. See Fleck (2026a, 2026b). The data are Eurostat's monthly imports by partner country (nrg_ti_gasm), monthly gas balances (nrg_cb_gasm) and annual energy balances (nrg_bal_c). Unless noted otherwise, the Eurostat data used in this note end in July 2026; the storage and price data run into October 2026. Return to text
5. The monthly import data mostly record the country from which the gas entered the EU. The estimate reassigns transit countries to the country of origin (Ukraine and Belarus to Russia, Turkey to Azerbaijan and Russia, Tunisia and Morocco to Algeria) and drops flows that re-enter the EU. The estimated annual totals are within 3.5 percent of the entry-point flows compiled by Bruegel (Keliauskaitė and others, 2022) in every year from 2019 to 2025. Return to text
6. Regulation (EU) 2026/261 of January 26, 2026, Articles 3 and 4: imports of Russian LNG under short-term contracts are prohibited from April 25, 2026, and under long-term contracts from January 1, 2027; Russian pipeline gas under long-term contracts from September 30 or November 1, 2027. Return to text
7. The share of the world's LNG that passes through the Strait of Hormuz is from IEA (2026a). The EU's shares come from the Eurostat-based estimate of imports by origin. In the monthly data, the LNG of France, Germany and Belgium is allocated to origins with their 2024 annual partner shares, which overstate Qatar's deliveries in 2026; the Qatari volumes that other member states report directly fell by about two-thirds. Return to text
8. One model is estimated for each of the 25 EU countries with a gas market (all member states except Cyprus, which has none, and Malta, which uses a negligible amount; 99.9 percent of EU consumption). The model projections imply that the decline in 2025 was 14.3 percent relative to the weather-adjusted counterfactual (90 percent interval: 10.5 to 18.4 percent). Fleck (2026a) presents the method and the results for the euro area, where the 2025 shortfall is 15.3 percent, and splits the shortfall between power plants and other users (16 countries). Return to text
9. Imports from Russia are Eurostat's reported imports from Russia, Ukraine and Turkey; net imports from other countries are all other imports, plus transfers, less exports. In the Import Scarcity scenario, LNG imports over October to March are 51 bcm, against 77 bcm a year earlier and in the Baseline, so that total supply is 26 bcm lower. Stocks follow Eurostat's definition (gas held on national territory and abroad) and are chained from the June 2023 level with the monthly stock changes; August and September 2026 are bridged with GIE's daily storage data at 10.55 terawatt hours per bcm. Storage capacity is GIE's working gas volume, about 107 bcm, and the percentages of capacity in the text and in Figure 5 divide the Eurostat-definition stocks by it. Eurostat's stocks include gas held outside the EU and run 3 to 5 bcm above GIE's underground storage for the same date (end of March 2026: 35 bcm, or 32 percent of capacity, against GIE's 30 bcm, or 28 percent, in Figure 1), so the fill rates in Figure 5 are 3 to 5 percentage points higher than GIE's. The "Avg. 2022–2025" path applies the average fill rate for each month over the winters 2022–23 to 2025–26 to this capacity. Return to text
10. Since 2011, the EU-wide fill level in GIE's daily data has dropped below 20 percent of working gas capacity only once, for four weeks in March and April 2018, with a low of 17.7 percent. Return to text
11. NOAA Climate Prediction Center (2026a, 2026b). Index values are from NOAA's Oceanic Niño Index table (three-month running means of sea surface temperature anomalies in the Niño-3.4 region); the previous high for July to September was 1.79 in 1997. NOAA now measures event strength with the relative index, which subtracts the tropical mean; on that index the July to September 2026 value is 1.69, below 1997. NOAA's probability refers to a three-month relative index of 2.5 or more. Return to text
12. Winters are classified by NOAA's Oceanic Niño Index for December to February; since 1980–81, strong events (index of 1.5 or more) occurred in 1982–83, 1991–92, 1997–98, 2015–16 and 2023–24. Heating degree days are weighted by the 25 EU countries' gas consumption; the trend is a linear trend over the winters 1980–81 to 2025–26. The difference from other winters is statistically significant (permutation p-value of 0.03), but counting 2009–10 (index of 1.47) as a strong event reduces the average to about 4 percent. Fleck (2026b) presents the same analysis for the euro area. Return to text
Fleck, Johannes (2026). "Europe’s Natural Gas Outlook for the Upcoming Winter 2026/2027," FEDS Notes. Washington: Board of Governors of the Federal Reserve System, November 20, 2026, https://doi.org/10.17016/2380-7172.4219.